Chronic myelomonocytic leukemia (CMML) is defined by absolute (≥ 0.5 x10 9/L) and relative (≥ 10%) monocytosis in peripheral blood. Presence of significant dysplasia in any of the three myeloid series, in particular dysgranulopoiesis, is an almost constant finding in CMML. In the absence of a clonal marker, a scenario very unlikely with the advent of next-generation sequencing (NGS), significant myeloid dysplasia becomes a crucial criterion for establishing the diagnosis. Although bone marrow dysplasia has demonstrated independent prognostic value in MDS, its significance in relation to CMML has never been assessed. The main interest of our work was to evaluate the genomic determinants of dysplasia and to assess its prognostic impact.
We analyzed a series of 240 patients with CMML with clinical, morphological, immunophenotypic, cytogenetic and molecular information. Patients were diagnosed following WHO and ICC 2022 recommendations. As a novelty with respect to previous WHO classifications, the new definition of CMML includes those patients previously categorized as oligomonocytic CMML (OM-CMML). That is, myelodysplastic neoplasms (MDS) or unclassifiable myelodysplastic/myeloproliferative neoplasms with relative monocytosis and a monocyte count of 0.5 × 10 9/L to <1 × 10 9/L. A total of 167 (71%) patients were diagnosed with CMML-1 and 67 (29%) with CMML-2. Likewise, 193 (80%) patients were diagnosed with dysplastic CMML, 55 of whom would meet criteria for OM-CMML, and 47 (20%) were diagnosed with proliferative CMML.
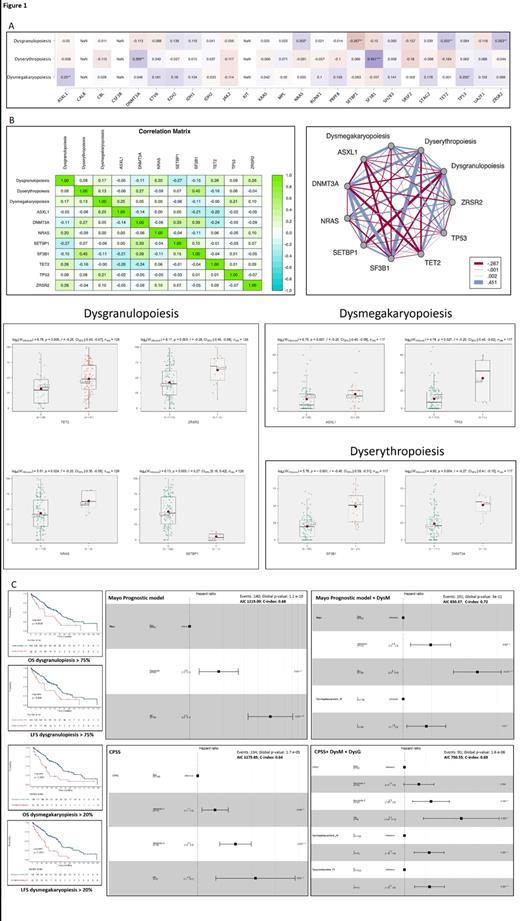
We assessed associations between dysmyelopoiesis and gene mutations by Spearman's rank correlation coefficient. Dysgranulopoiesis showed a significant positive correlation with NRAS, TET2 and ZRSR2 mutations; while a significant negative correlation with SETBP1 was observed. Dysmegakaryopoiesis showed a significant positive correlation with ASXL1 and TP53. Dyserythropoiesis showed a significant positive correlation with DNMT3A and SF3B1. The heatmap and matrix showing these correlations, as well as the differences in the degree of dysmyelopoiesis among these specific mutations are depicted in Figure 1-A & 1-B. Later, we wanted to assess the prognostic impact of dysgranulopoiesis, dyserythropoiesis and dysmegakaryopoiesis in terms of overall survival (OS) and leukemia-free survival (LFS) in our series. By applying the MaxStat package in R, it allowed us to detect the best cut-off points for dysgranulopoiesis (>75%) and dysmegakaryopoiesis (>20%) to separate our series into two groups with significantly different outcomes (Figure 1-C). We were unable to detect a significant cut-off point for dyserythropoiesis and the presence of multilineage dysplasia also showed no prognostic impact. CMML patients with dysgranulopoiesis above 75% showed a significant shorter median OS (34.4 vs 67.8 months; Hazard Ratio (HR): 1,99 [1.24-3.19]; P=0.0036) and LFS (33.4 vs 66.6 months; HR: 1,87 [1.17-3]; P=0.008). Likewise, patients with dysmegakaryopoiesis above 20% also showed a significant shorter median OS (30.2 vs 67.1 months; HR: 2.52 [1.63-3.88]; P<0.0001) and LFS (30.4 vs 66.6 months; HR: 2.76 [1.78-4.28]; P<0.0001). Remarkably, dysmegakaryopoiesis above 20% and dysgranulopoiesis above 75% were identified as independent prognostic factors for both OS and LFS after adjustment by multivariable Cox
regression analyses by CMML-specific prognostic scoring system (CPSS) and Mayo Prognostic Model. Furthermore, the addition of dysmegakaryopoiesis above 20% and dysgranulopoiesis above 75% to these prognostic indices improved their prognostic accuracy in terms of OS as assessed by a C-index for right-censored data (Figure 1-C).
In conclusion, our study has allowed us to detect mutations in genes related to dysmyelopoiesis. In addition, both dysgranulopoiesis and dysmegakaryopoiesis have demonstrated a negative prognostic impact on the survival of patients in our series that was not captured by the CPSS and Mayo prognostic model. Their worse prognosis could be partially justified by their association with poor prognostic mutations (e.g. NRAS, ASXL1, TP53), which allows us to visualize them as a good surrogate of poor prognostic molecular profiles.
Disclosures
No relevant conflicts of interest to declare.


